


San Miguel County, New Mexico
About
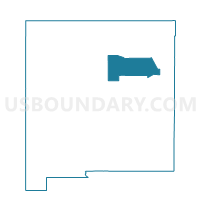
Outline

Summary
| Unique Area Identifier | 119561 |
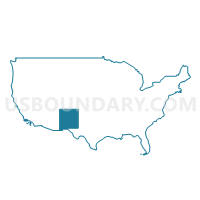
| Name | San Miguel County |
| State | New Mexico |
| Area (square miles) | 4,735.66 |
| Land Area (square miles) | 4,715.82 |
| Water Area (square miles) | 19.84 |
| % of Land Area | 99.58 |
| % of Water Area | 0.42 |
| Latitude of the Internal Point | 35.47687580 |
| Longtitude of the Internal Point | -104.80351460 |
| Total Population | 29,393 |
| Total Housing Units | 15,595 |
| Total Households | 11,978 |
| Median Age | 40.7 |
Maps
Graphs
Select a template below for downloading or customizing gragh for San Miguel County, New Mexico


Neighbors
Neighoring County (by Name) Neighboring County on the Map
- Guadalupe County, NM
- Harding County, NM
- Mora County, NM
- Quay County, NM
- Santa Fe County, NM
- Torrance County, NM
County Subdivision in San Miguel County (by Name) Neighboring County Subdivision on the Map
- Conchas Dam CCD, San Miguel County, NM
- Las Vegas CCD, San Miguel County, NM
- Pecos CCD, San Miguel County, NM
- Trementina CCD, San Miguel County, NM
- Villanueva CCD, San Miguel County, NM
Top 10 Neighboring Place (by Population) Neighboring Place on the Map
- Las Vegas city, NM (13,753)
- Pecos village, NM (1,392)
- East Pecos CDP, NM (757)
- Ribera CDP, NM (416)
- Rowe CDP, NM (415)
- Tecolote CDP, NM (298)
- Tecolotito CDP, NM (232)
- Villanueva CDP, NM (229)
- Soham CDP, NM (210)
- Conchas Dam CDP, NM (186)
Top 10 Neighboring Unified School District (by Population) Neighboring Unified School District on the Map
- Santa Fe Public Schools, NM (118,032)
- Moriarty Municipal Schools, NM (23,044)
- Las Vegas City Public Schools, NM (13,348)
- West Las Vegas Public Schools, NM (11,020)
- Pojoaque Valley Public Schools, NM (9,637)
- Tucumcari Public Schools, NM (6,943)
- Pecos Independent Schools, NM (4,979)
- Santa Rosa Consolidated Schools, NM (4,455)
- Mora Independent Schools, NM (4,023)
- Logan Municipal Schools, NM (1,323)
Top 10 Neighboring State Legislative District Lower Chamber (by Population) Neighboring State Legislative District Lower Chamber on the Map
- State House District 50, NM (31,808)
- State House District 46, NM (29,009)
- State House District 47, NM (28,195)
- State House District 67, NM (25,041)
- State House District 40, NM (24,506)
- State House District 70, NM (23,913)
- State House District 68, NM (23,727)
Top 10 Neighboring State Legislative District Upper Chamber (by Population) Neighboring State Legislative District Upper Chamber on the Map
- State Senate District 6, NM (48,126)
- State Senate District 39, NM (48,118)
- State Senate District 25, NM (45,495)
- State Senate District 7, NM (42,634)
- State Senate District 8, NM (40,059)
Top 10 Neighboring 111th Congressional District (by Population) Neighboring 111th Congressional District on the Map
- Congressional District 1, NM (701,939)
- Congressional District 3, NM (693,284)
- Congressional District 2, NM (663,956)
Top 10 Census Tract in San Miguel County (by Population) Neighboring Census Tract on the Map
- Census Tract 9576, San Miguel County, NM (6,445)
- Census Tract 9574, San Miguel County, NM (4,532)
- Census Tract 9578, San Miguel County, NM (4,510)
- Census Tract 9575, San Miguel County, NM (4,395)
- Census Tract 9572, San Miguel County, NM (3,797)
- Census Tract 9573, San Miguel County, NM (3,257)
- Census Tract 9577, San Miguel County, NM (2,457)
Top 10 Neighboring 5-Digit ZIP Code Tabulation Area (by Population) Neighboring 5-Digit ZIP Code Tabulation Area on the Map
- 87701, NM (20,081)
- 87501, NM (15,147)
- 87506, NM (12,580)
- 88401, NM (6,944)
- 88435, NM (3,559)
- 87522, NM (3,384)
- 87552, NM (3,325)
- 87732, NM (1,672)
- 87560, NM (1,445)
- 87535, NM (1,270)
Data
Demographic, Population, Households, and Housing Units
** Data sources from census 2010 **
Show Data on Map
Download Full List as CSV
Download Quick Sheet as CSV
| Subject | This Area | New Mexico | National |
|---|---|---|---|
| POPULATION | |||
| Total Population Map | 29,393 | 2,059,179 | 308,745,538 |
| POPULATION, HISPANIC OR LATINO ORIGIN | |||
| Not Hispanic or Latino Map | 6,810 | 1,105,776 | 258,267,944 |
| Hispanic or Latino Map | 22,583 | 953,403 | 50,477,594 |
| POPULATION, RACE | |||
| White alone Map | 19,583 | 1,407,876 | 223,553,265 |
| Black or African American alone Map | 412 | 42,550 | 38,929,319 |
| American Indian and Alaska Native alone Map | 508 | 193,222 | 2,932,248 |
| Asian alone Map | 228 | 28,208 | 14,674,252 |
| Native Hawaiian and Other Pacific Islander alone Map | 37 | 1,810 | 540,013 |
| Some Other Race alone Map | 7,478 | 308,503 | 19,107,368 |
| Two or More Races Map | 1,147 | 77,010 | 9,009,073 |
| POPULATION, SEX | |||
| Male Map | 14,661 | 1,017,421 | 151,781,326 |
| Female Map | 14,732 | 1,041,758 | 156,964,212 |
| POPULATION, AGE (18 YEARS) | |||
| 18 years and over Map | 22,931 | 1,540,507 | 234,564,071 |
| Under 18 years | 6,462 | 518,672 | 74,181,467 |
| POPULATION, AGE | |||
| Under 5 years | 1,622 | 144,981 | 20,201,362 |
| 5 to 9 years | 1,678 | 143,308 | 20,348,657 |
| 10 to 14 years | 1,835 | 141,691 | 20,677,194 |
| 15 to 17 years | 1,327 | 88,692 | 12,954,254 |
| 18 and 19 years | 1,151 | 61,169 | 9,086,089 |
| 20 years | 508 | 29,935 | 4,519,129 |
| 21 years | 444 | 28,237 | 4,354,294 |
| 22 to 24 years | 1,083 | 84,198 | 12,712,576 |
| 25 to 29 years | 1,670 | 139,678 | 21,101,849 |
| 30 to 34 years | 1,522 | 127,567 | 19,962,099 |
| 35 to 39 years | 1,577 | 123,303 | 20,179,642 |
| 40 to 44 years | 1,664 | 125,220 | 20,890,964 |
| 45 to 49 years | 2,298 | 144,839 | 22,708,591 |
| 50 to 54 years | 2,283 | 147,170 | 22,298,125 |
| 55 to 59 years | 2,187 | 136,799 | 19,664,805 |
| 60 and 61 years | 906 | 51,238 | 7,113,727 |
| 62 to 64 years | 1,169 | 68,899 | 9,704,197 |
| 65 and 66 years | 656 | 37,921 | 5,319,902 |
| 67 to 69 years | 924 | 49,969 | 7,115,361 |
| 70 to 74 years | 1,152 | 65,904 | 9,278,166 |
| 75 to 79 years | 790 | 50,230 | 7,317,795 |
| 80 to 84 years | 517 | 36,238 | 5,743,327 |
| 85 years and over | 430 | 31,993 | 5,493,433 |
| MEDIAN AGE BY SEX | |||
| Both sexes Map | 40.70 | 36.70 | 37.20 |
| Male Map | 40.10 | 35.30 | 35.80 |
| Female Map | 41.40 | 38.00 | 38.50 |
| HOUSEHOLDS | |||
| Total Households Map | 11,978 | 791,395 | 116,716,292 |
| HOUSEHOLDS, HOUSEHOLD TYPE | |||
| Family households: Map | 7,275 | 518,698 | 77,538,296 |
| Husband-wife family Map | 4,629 | 358,354 | 56,510,377 |
| Other family: Map | 2,646 | 160,344 | 21,027,919 |
| Male householder, no wife present Map | 860 | 49,408 | 5,777,570 |
| Female householder, no husband present Map | 1,786 | 110,936 | 15,250,349 |
| Nonfamily households: Map | 4,703 | 272,697 | 39,177,996 |
| Householder living alone Map | 3,898 | 221,347 | 31,204,909 |
| Householder not living alone Map | 805 | 51,350 | 7,973,087 |
| HOUSEHOLDS, HISPANIC OR LATINO ORIGIN OF HOUSEHOLDER | |||
| Not Hispanic or Latino householder: Map | 3,088 | 477,947 | 103,254,926 |
| Hispanic or Latino householder: Map | 8,890 | 313,448 | 13,461,366 |
| HOUSEHOLDS, RACE OF HOUSEHOLDER | |||
| Householder who is White alone | 8,159 | 583,668 | 89,754,352 |
| Householder who is Black or African American alone | 103 | 16,087 | 14,129,983 |
| Householder who is American Indian and Alaska Native alone | 168 | 56,494 | 939,707 |
| Householder who is Asian alone | 60 | 9,573 | 4,632,164 |
| Householder who is Native Hawaiian and Other Pacific Islander alone | 17 | 597 | 143,932 |
| Householder who is Some Other Race alone | 2,997 | 102,631 | 4,916,427 |
| Householder who is Two or More Races | 474 | 22,345 | 2,199,727 |
| HOUSEHOLDS, HOUSEHOLD TYPE BY HOUSEHOLD SIZE | |||
| Family households: Map | 7,275 | 518,698 | 77,538,296 |
| 2-person household Map | 3,244 | 216,503 | 31,882,616 |
| 3-person household Map | 1,799 | 116,153 | 17,765,829 |
| 4-person household Map | 1,245 | 96,379 | 15,214,075 |
| 5-person household Map | 634 | 52,499 | 7,411,997 |
| 6-person household Map | 208 | 21,714 | 3,026,278 |
| 7-or-more-person household Map | 145 | 15,450 | 2,237,501 |
| Nonfamily households: Map | 4,703 | 272,697 | 39,177,996 |
| 1-person household Map | 3,898 | 221,347 | 31,204,909 |
| 2-person household Map | 699 | 43,741 | 6,360,012 |
| 3-person household Map | 63 | 5,199 | 992,156 |
| 4-person household Map | 30 | 1,662 | 411,171 |
| 5-person household Map | 9 | 498 | 126,634 |
| 6-person household Map | 1 | 131 | 48,421 |
| 7-or-more-person household Map | 3 | 119 | 34,693 |
| HOUSING UNITS | |||
| Total Housing Units Map | 15,595 | 901,388 | 131,704,730 |
| HOUSING UNITS, OCCUPANCY STATUS | |||
| Occupied Map | 11,978 | 791,395 | 116,716,292 |
| Vacant Map | 3,617 | 109,993 | 14,988,438 |
| HOUSING UNITS, OCCUPIED, TENURE | |||
| Owned with a mortgage or a loan Map | 4,117 | 337,570 | 52,979,430 |
| Owned free and clear Map | 4,317 | 204,552 | 23,006,644 |
| Renter occupied Map | 3,544 | 249,273 | 40,730,218 |
| HOUSING UNITS, VACANT, VACANCY STATUS | |||
| For rent Map | 407 | 22,150 | 4,137,567 |
| Rented, not occupied Map | 20 | 1,303 | 206,825 |
| For sale only Map | 117 | 11,050 | 1,896,796 |
| Sold, not occupied Map | 31 | 2,143 | 421,032 |
| For seasonal, recreational, or occasional use Map | 1,846 | 36,612 | 4,649,298 |
| For migrant workers Map | 3 | 229 | 24,161 |
| Other vacant Map | 1,193 | 36,506 | 3,652,759 |
| HOUSING UNITS, OCCUPIED, AVERAGE HOUSEHOLD SIZE BY TENURE | |||
| Total: Map | 2.34 | 2.55 | 2.58 |
| Owner occupied Map | 2.43 | 2.60 | 2.65 |
| Renter occupied Map | 2.13 | 2.43 | 2.44 |
| HOUSING UNITS, OCCUPIED, TENURE BY RACE OF HOUSEHOLDER | |||
| Owner occupied: Map | 8,434 | 542,122 | 75,986,074 |
| Householder who is White alone Map | 5,921 | 414,357 | 63,446,275 |
| Householder who is Black or African American alone Map | 32 | 7,303 | 6,261,464 |
| Householder who is American Indian and Alaska Native alone Map | 93 | 36,654 | 509,588 |
| Householder who is Asian alone Map | 27 | 5,668 | 2,688,861 |
| Householder who is Native Hawaiian and Other Pacific Islander alone Map | 6 | 307 | 61,911 |
| Householder who is Some Other Race alone Map | 2,012 | 64,703 | 1,975,817 |
| Householder who is Two or More Races Map | 343 | 13,130 | 1,042,158 |
| Renter occupied: Map | 3,544 | 249,273 | 40,730,218 |
| Householder who is White alone Map | 2,238 | 169,311 | 26,308,077 |
| Householder who is Black or African American alone Map | 71 | 8,784 | 7,868,519 |
| Householder who is American Indian and Alaska Native alone Map | 75 | 19,840 | 430,119 |
| Householder who is Asian alone Map | 33 | 3,905 | 1,943,303 |
| Householder who is Native Hawaiian and Other Pacific Islander alone Map | 11 | 290 | 82,021 |
| Householder who is Some Other Race alone Map | 985 | 37,928 | 2,940,610 |
| Householder who is Two or More Races Map | 131 | 9,215 | 1,157,569 |
| HOUSING UNITS, OCCUPIED, TENURE BY HISPANIC OR LATINO ORIGIN OF HOUSEHOLDER | |||
| Owner occupied: Map | 8,434 | 542,122 | 75,986,074 |
| Not Hispanic or Latino householder Map | 2,104 | 334,598 | 69,617,625 |
| Hispanic or Latino householder Map | 6,330 | 207,524 | 6,368,449 |
| Renter occupied: Map | 3,544 | 249,273 | 40,730,218 |
| Not Hispanic or Latino householder Map | 984 | 143,349 | 33,637,301 |
| Hispanic or Latino householder Map | 2,560 | 105,924 | 7,092,917 |
| HOUSING UNITS, OCCUPIED, TENURE BY HOUSEHOLD SIZE | |||
| Owner occupied: Map | 8,434 | 542,122 | 75,986,074 |
| 1-person household Map | 2,342 | 129,376 | 16,453,569 |
| 2-person household Map | 3,027 | 197,623 | 27,618,605 |
| 3-person household Map | 1,353 | 83,241 | 12,517,563 |
| 4-person household Map | 946 | 69,174 | 10,998,793 |
| 5-person household Map | 499 | 36,671 | 5,057,765 |
| 6-person household Map | 158 | 15,045 | 1,965,796 |
| 7-or-more-person household Map | 109 | 10,992 | 1,373,983 |
| Renter occupied: Map | 3,544 | 249,273 | 40,730,218 |
| 1-person household Map | 1,556 | 91,971 | 14,751,340 |
| 2-person household Map | 916 | 62,621 | 10,624,023 |
| 3-person household Map | 509 | 38,111 | 6,240,422 |
| 4-person household Map | 329 | 28,867 | 4,626,453 |
| 5-person household Map | 144 | 16,326 | 2,480,866 |
| 6-person household Map | 51 | 6,800 | 1,108,903 |
| 7-or-more-person household Map | 39 | 4,577 | 898,211 |
Loading...